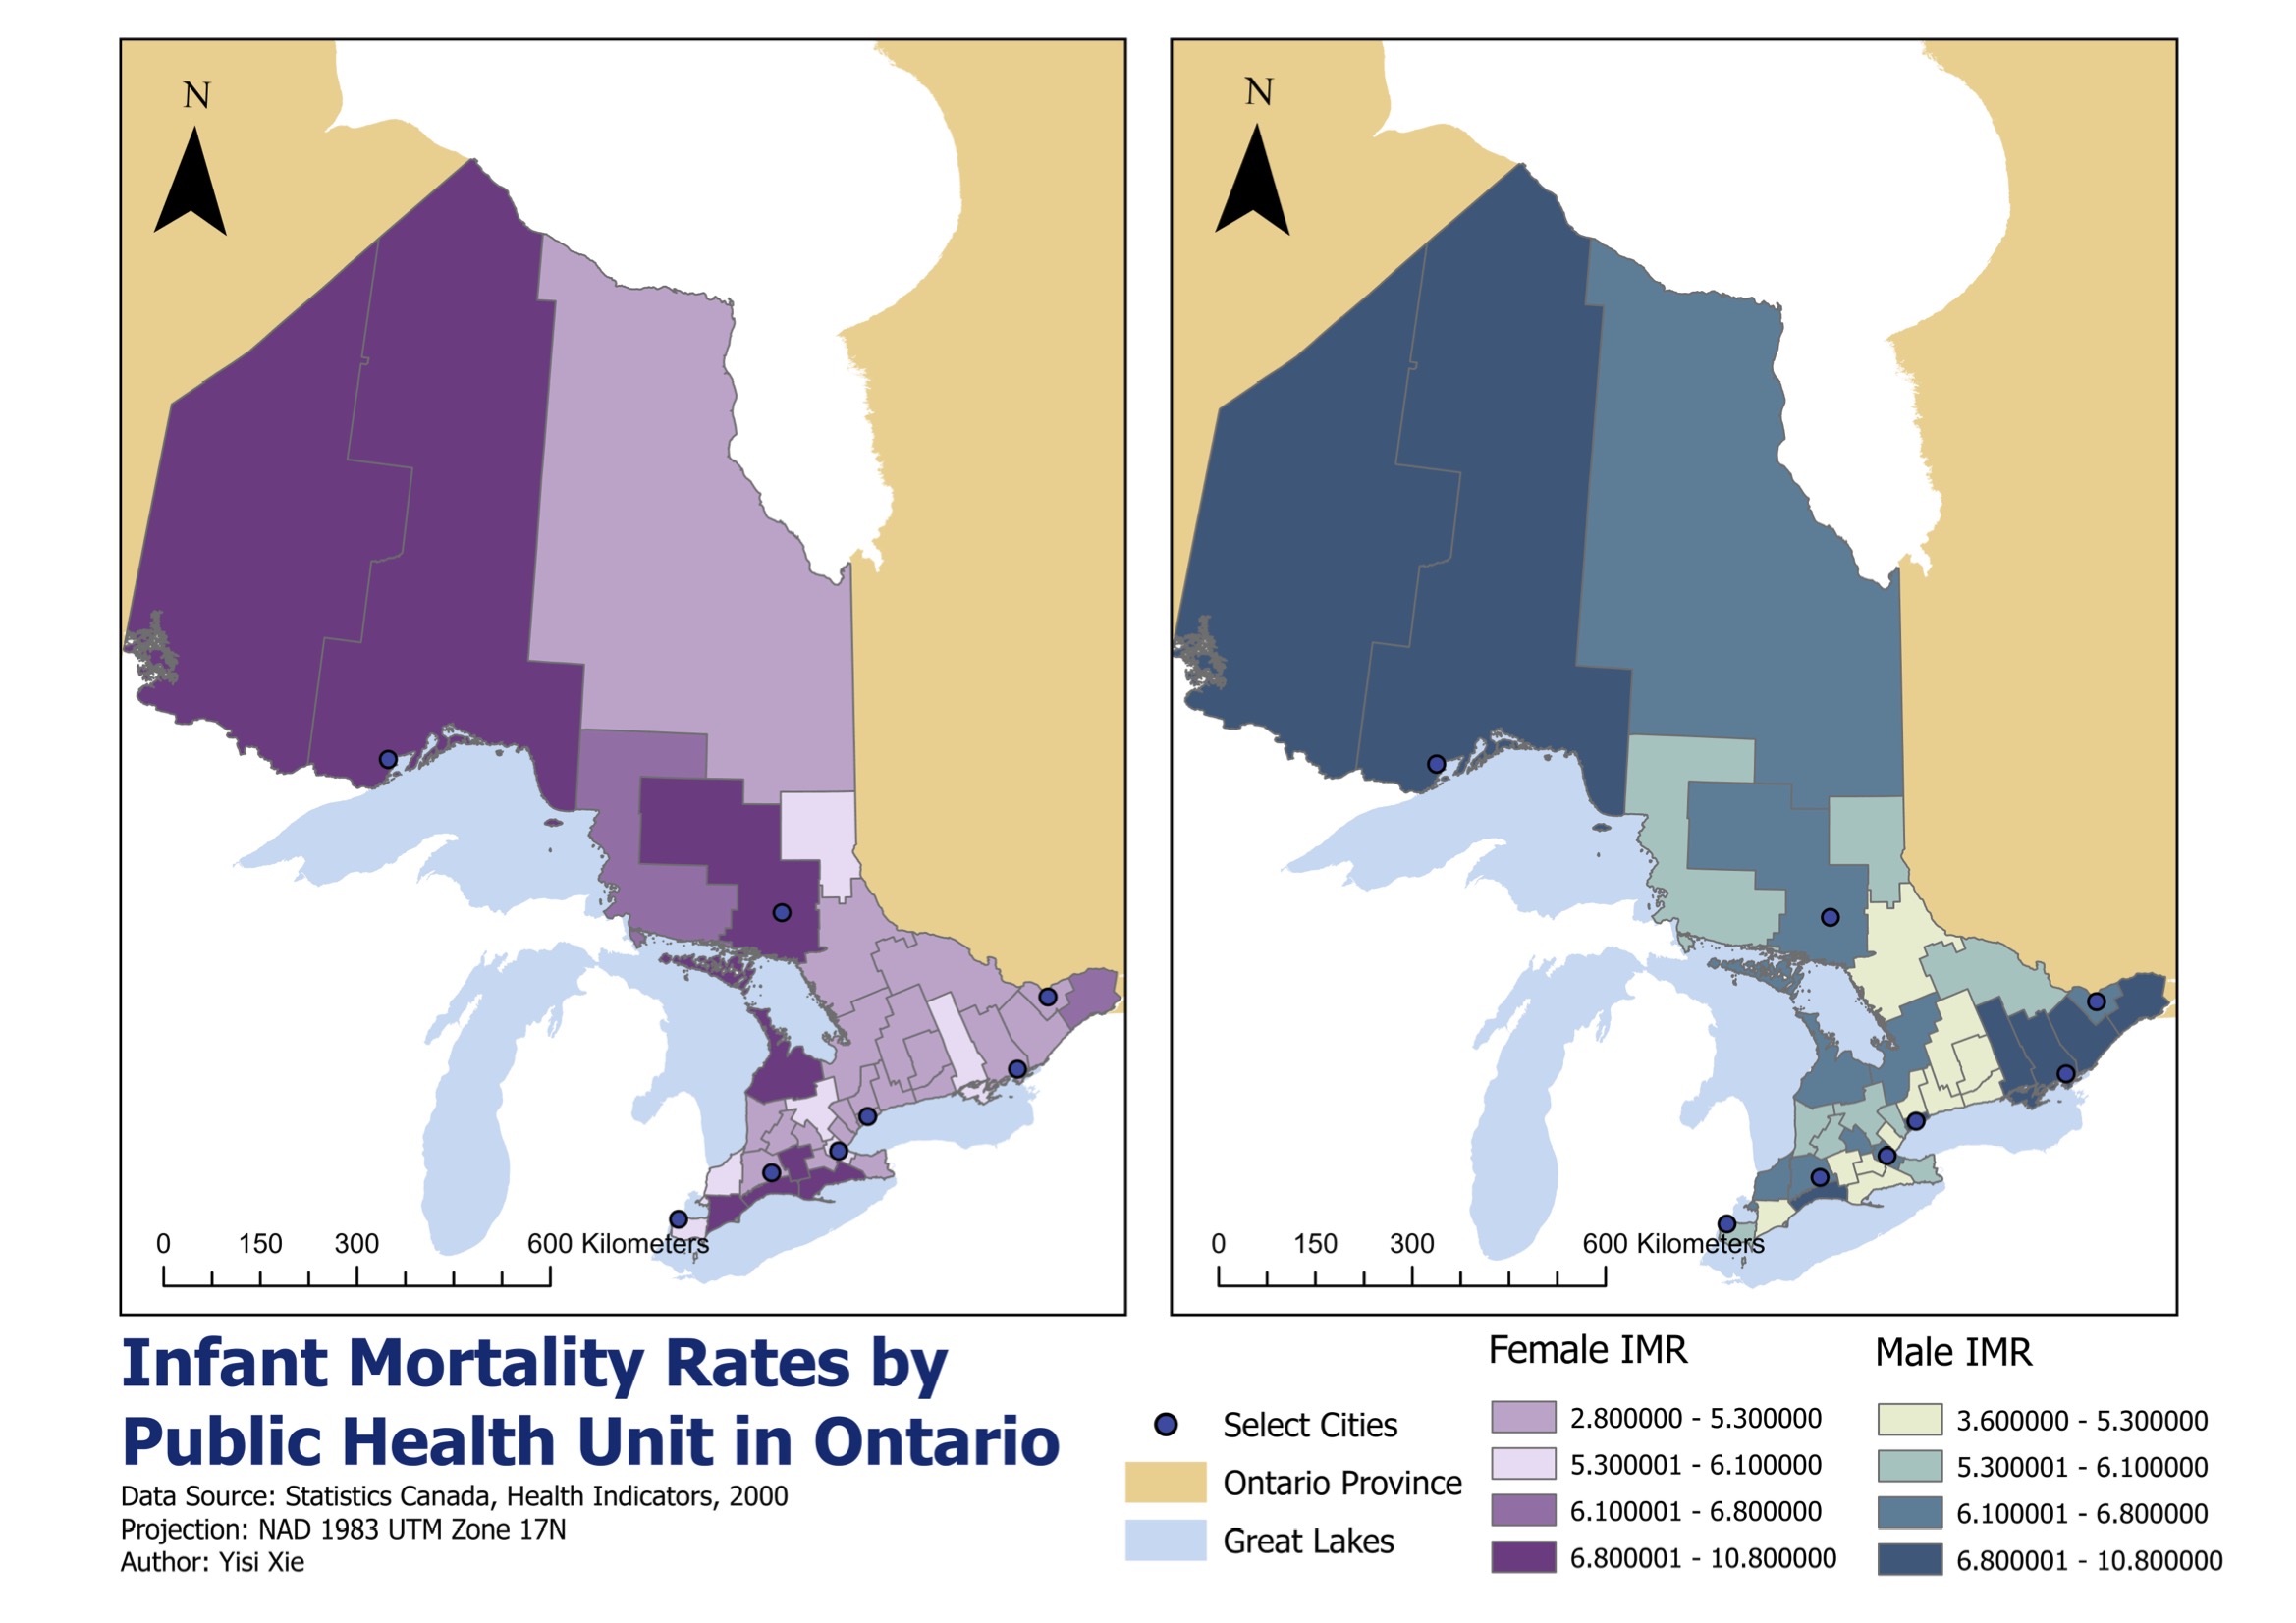

The first part maps infant mortality rates across Ontario public health units by sex. The second part uses Local Indicators of Spatial Association to identify clusters and outliers in child and senior road collision rates.
Together, the maps show how public health risk can be uneven in two ways: across broad regions, and within neighbourhood-level spatial relationships.
Infant mortality data were joined to public health unit boundaries using shared identifiers. Instead of letting each map generate independent class breaks, I used one breakpoint scheme for both male and female rates.
- Join fieldHealth-unit identifiers linked tabular rates to spatial boundaries.
- ProjectionNAD 1983 Statistics Canada Lambert supported provincial mapping.
- ClassificationBreaks derived from the wider male IMR range were applied consistently to both maps.
This avoids a common cartographic trap: the same colour meaning different values on paired maps.

Collision counts were standardized by age-specific population to avoid mistaking large populations for high risk. Child and senior injury rates were calculated per 1,000 people before spatial cluster detection.
- RateInjuries divided by relevant age-group population, multiplied by 1,000.
- WeightsQueen's case contiguity defined neighbours through shared edges or corners.
- LISALocal Moran's I identified high-high, low-low, high-low, and low-high patterns.
Infant mortality shows a broad north-south gradient. Road collision risk, however, is more local and age-specific: child clusters point toward dense urban exposure, while senior clusters appear more strongly in suburban crossing environments.
The conclusion is practical: health and safety interventions should not be designed from provincial averages alone. Spatial clusters tell planners where the same rate is reinforced by its neighbours, and where a place is an unusual outlier.
LISA identifies spatial association, not the cause of that association. The maps are best read as a diagnostic layer that points to where deeper policy, infrastructure, and demographic investigation should begin.